


Trading Indicator
DeMarker (DeM) Indicator Strategy for Automated Trading
Learn how DeMarker rules can be translated into no-code automated trading strategies with Tradeworks.

Fundamentals
Understanding DeMarker
DeMarker technical indicator (DeM) is based on the comparison of the period maximum with the previous period maximum.
Below is a DeMarker (DeM) indicator strategy for automated trading. DeMarker measures buying and selling pressure with values between 0 and 1, making it straightforward to automate.
How DeMarker Works in Automated Trading
- DeM Values: Range from 0 to 1 (sometimes expressed as 0-100)
- DeM above 0.5: Buying pressure increasing - potential upward momentum
- DeM below 0.5: Selling pressure increasing - potential downward momentum
- Extreme Levels: Above 0.7 or below 0.3 indicate potential trend exhaustion
DeMarker technical indicator (DeM) is based on the comparison of the period maximum with the previous period maximum. It helps identify potential trend exhaustion through price comparisons between adjacent periods, making it valuable for algo trading strategies.
DeMarker Strategy 1: Overbought/Oversold (0.7/0.3)

The DeMarker Midline Crossover strategy uses the 0.5 threshold to identify shifts in buying and selling pressure, testing entries when momentum changes direction.
Setup in Tradeworks
- Add DeMarker indicator to your strategy
- Set parameters: Period = 14 (standard)
- Configure entry conditions:
- Open Position Buy Signal: DeMarker crosses from below to above 0.5
- Open Position Sell Signal: DeMarker crosses from above to below 0.5
Trade Management
- Stop Loss Exit Signal:
- Take Profit Exit Signal:
- Testing note: Compare chart intervals and instruments in backtesting before deciding where this setup fits your approach.
- Common Pairs: Major pairs with clear trend cycles (EUR/USD, GBP/USD)
- Filter: Add trend alignment (require price above Moving Average (50) for long entries)
DeMarker Strategy 2: Zero-Line Crossover

The DeMarker Trend Exhaustion strategy tests whether extreme DeMarker readings can help identify trend exhaustion and possible reversal areas.
Setup in Tradeworks
- Add DeMarker indicator to your strategy
- Set parameters: Period = 14
- Configure entry conditions:
- Open Position Buy Signal: DeMarker below 0.3 (oversold) AND DeMarker crosses from below to above 0.3
- Open Position Sell Signal: DeMarker above 0.7 (overbought) AND DeMarker crosses from above to below 0.7
Trade Management
- Stop Loss Exit Signal:
- Take Profit Exit Signal:
- For longs: Set condition to 'DeMarker is greater than 0.6'
- For shorts: Set condition to 'DeMarker is less than 0.4'
- Common Timeframe: 4-hour to daily charts for trend exhaustion signals
- Common Pairs: Pairs with clear trend cycles (EUR/USD, GBP/USD, EUR/GBP)
- Filter: Add ADX above 25 to ensure trending market (not ranging)
DeMarker Strategy 3: Trend Filter
Beyond standalone strategies, DeMarker can be tested as a filter for other trading systems. Its price-extreme logic can support confirmation rules from other indicators or help flag possible trend-reversal conditions.
Using DeMarker as Filter
- Entry Confirmation: Only enter trades when DeMarker aligns with your primary signal direction
- Trend Exhaustion Warning: Exit or reduce position size when DeMarker reaches extreme levels (above 0.7 or below 0.3)
- Divergence Trading: Look for price/DeMarker divergence for early reversal signals
- Multi-Timeframe: Use DeMarker on higher timeframe for trend direction, lower for entry timing
Combining with Other Indicators
- Trend Indicator: Add Moving Average to confirm trend direction
- Volatility: Use Average True Range (ATR) for dynamic stop losses
- Momentum: Combine with RSI for stronger confirmation
- Pattern Recognition: Use with Fractals for support/resistance confirmation
For Bot Developers: Implementation Tips
Choosing DeMarker Parameters
- Sensitivity: Shorter periods (7-10) for faster signals but more false positives
- Baseline: Standard 14 is a common starting point before testing alternatives
- Smoothing: Higher periods (20-28) for cleaner signals but slower response
- Timeframe Adjustment: Use standard settings for 1h-4h charts, longer periods for daily/weekly
Combining with Other Indicators
- Trend Filter: Add Moving Average to confirm trend direction
- Volatility Adjustment: Use Average True Range (ATR) for dynamic stop losses
- Confirmation: Add MACD for additional momentum confirmation
- Multi-Timeframe: Use DeMarker on lower timeframe for entry timing, higher for trend context
Manageable Beginner Setup
- Start Simple: Use DeMarker 0.5 crossover with Moving Average trend filter
- Add Confirmation: Combine with RSI or Stochastic for stronger signals
- Test Extensively: Backtest with different DeMarker periods across multiple currency pairs
- Paper Trade First: Always run strategies on a demo/paper account before considering going live
Questions
Frequently Asked Questions
What is the DeMarker indicator and how does it work?
The DeMarker (DeM) indicator is a technical analysis tool that compares the most recent price maximum and minimum with the previous period's values. It measures buying and selling pressure by analyzing price relationships between adjacent periods, outputting values between 0 and 1.
How do I use DeMarker in automated trading?
In Tradeworks, you can configure DeMarker signals with simple threshold conditions: Buy signals trigger when DeMarker crosses above 0.5 (increasing buying pressure), and sell signals trigger when it crosses below 0.5 (increasing selling pressure). Its clean 0-1 range makes threshold programming straightforward.
What's the difference between DeMarker and RSI?
While both are bounded oscillators (0-1 for DeMarker, 0-100 for RSI), they measure different things. DeMarker compares period highs/lows with previous periods, while RSI measures price change magnitude. DeMarker is often used to test trend-exhaustion conditions, while RSI is often used to test momentum conditions.
Can DeMarker be used as a standalone indicator?
DeMarker can be tested as a filter or confirmation tool, especially when combined with other indicators. Use it alongside trend indicators (like Moving Average) to filter signals in the trend direction, or combine with volatility indicators (ATR) for dynamic stop loss placement.
Try it in Tradeworks
Want to try DeMarker in Tradeworks?
Build and test DeMarker rules in a no-code strategy builder before deciding whether they fit your trading approach.
Advanced Guides:
Trend Indicators
Trend indicators help traders identify the direction of market movement. They smooth price data to show whether an uptrend, downtrend, or sideways movement is occurring.

Simple Moving Average
Learn more →

Exponential Moving Average
Learn more →

Parabolic SAR
Learn more →

Heikin Ashi
Learn more →

High Low
Learn more →

Linear Regression
Learn more →

Two Pole Butterworth Filter
Learn more →

Ichimoku Kinko Hyo
Learn more →

Alligator
Learn more →

Envelopes
Learn more →

Doji Arrows
Learn more →
Oscillators
Oscillators are bounded indicators that move between set values. They help identify overbought and oversold conditions, momentum, and potential reversal points.

Relative Strength Index
Learn more →

Relative Momentum Index
Learn more →

Stochastic Oscillator
Learn more →
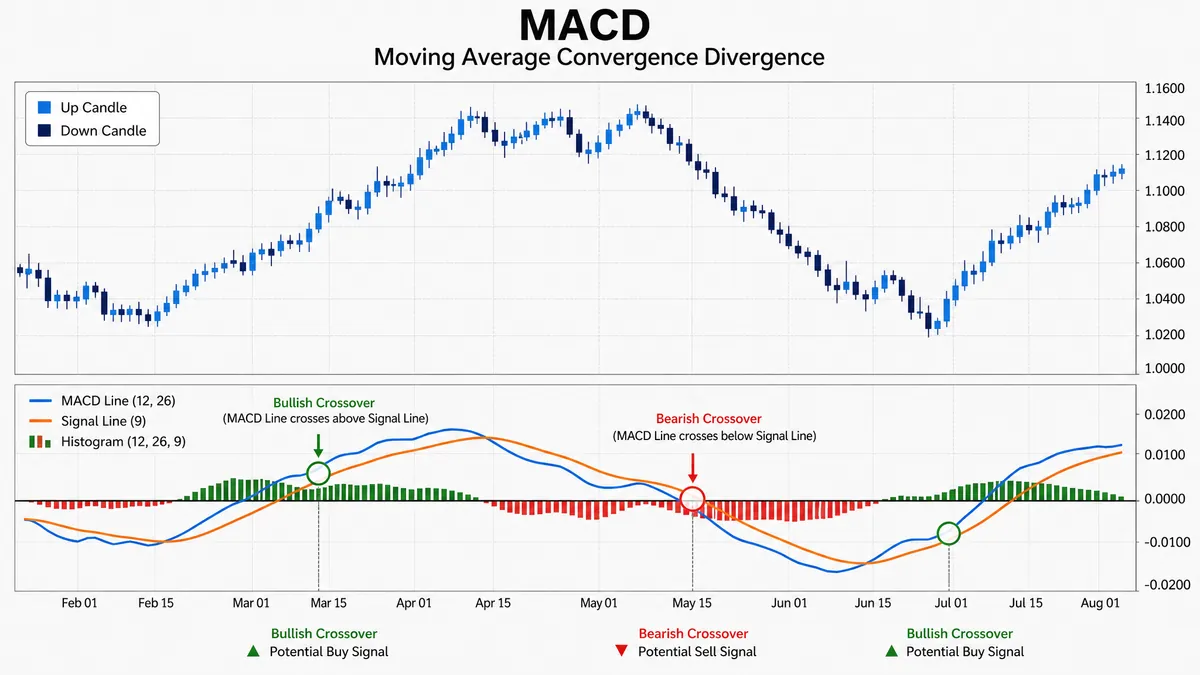
Moving Average Convergence/Divergence
Learn more →

Awesome Oscillator
Learn more →

Accelerator/Decelerator Oscillator
Learn more →

Commodity Channel Index
Learn more →

Relative Vigor Index
Learn more →

Williams' Percent Range
Learn more →

Gator Oscillator
Learn more →
DeMarker
Learn more →

Fisher Transform
Learn more →

Fisher CG
Learn more →

Laguerre RSI
Learn more →

Momentum
Learn more →

Moving Average of Oscillator
Learn more →
Volume Indicators
Volume indicators measure the strength of price movements by analyzing trading volume. They help confirm trends and identify potential reversals.


Volatility Indicators
Volatility indicators measure the rate of price change. They help traders set stop losses, determine risk levels, and identify potential breakouts.


Bill Williams Indicators
A collection of indicators developed by Bill Williams for trend identification, momentum analysis, and fractal pattern recognition.


