


Built-in Tools
36+ Trading Indicators
Choose from a comprehensive library of technical indicators to build and refine your trading strategies in Tradeworks.

Trend Indicators
Trend indicators help traders identify the direction of market movement. They smooth price data to show whether an uptrend, downtrend, or sideways movement is occurring.

Simple Moving Average
Learn more →

Exponential Moving Average
Learn more →

Parabolic SAR
Learn more →

Heikin Ashi
Learn more →

High Low
Learn more →

Linear Regression
Learn more →

Two Pole Butterworth Filter
Learn more →

Ichimoku Kinko Hyo
Learn more →

Alligator
Learn more →

Envelopes
Learn more →

Doji Arrows
Learn more →
Oscillators
Oscillators are bounded indicators that move between set values. They help identify overbought and oversold conditions, momentum, and potential reversal points.

Relative Strength Index
Learn more →

Relative Momentum Index
Learn more →

Stochastic Oscillator
Learn more →
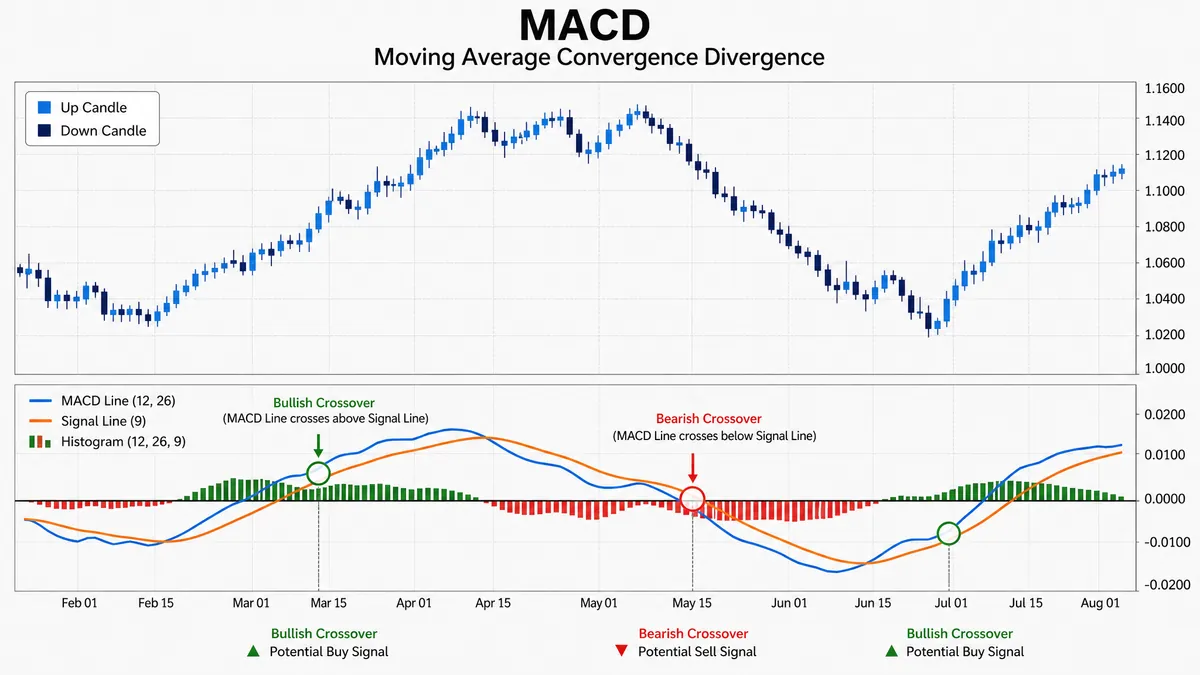
Moving Average Convergence/Divergence
Learn more →

Awesome Oscillator
Learn more →

Accelerator/Decelerator Oscillator
Learn more →

Commodity Channel Index
Learn more →

Relative Vigor Index
Learn more →

Williams' Percent Range
Learn more →

Gator Oscillator
Learn more →

DeMarker
Learn more →

Fisher Transform
Learn more →

Fisher CG
Learn more →

Laguerre RSI
Learn more →

Momentum
Learn more →

Moving Average of Oscillator
Learn more →
Volume Indicators
Volume indicators measure the strength of price movements by analyzing trading volume. They help confirm trends and identify potential reversals.


Volatility Indicators
Volatility indicators measure the rate of price change. They help traders set stop losses, determine risk levels, and identify potential breakouts.


Bill Williams Indicators
A collection of indicators developed by Bill Williams for trend identification, momentum analysis, and fractal pattern recognition.


